- Health insurance
- Paid time-off/vacation time
- Workplace retirement plan
Quick links
Retirement outlook by role
What your clients think now
5 min read

Everyone has a unique outlook and their own opinions, but workplace roles and experiences can color those views. When talking with retirement plan sponsor clients or prospects, the role your contact has at the organization likely influences much of what they think and feel.
Principal® conducts quarterly surveys of plan sponsor clients and individuals to bring you insights that should help you tailor your approach and recommendations and likely bring more success.*
Here's what we found when comparing C-suite respondents and those in human resources (HR) roles.
Common ground
They agree when it comes to the top three benefits employees find of interest:
They both feel:
Responsible for offering a workplace retirement plan
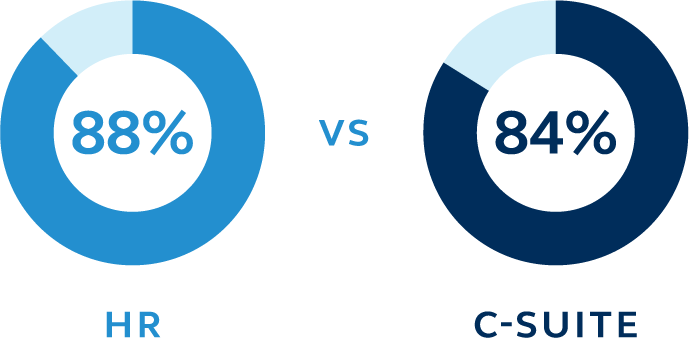
Responsible for offering financial wellness solutions
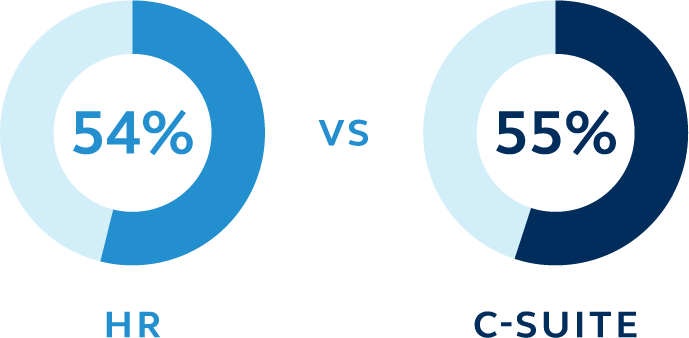
Participants want more investment education
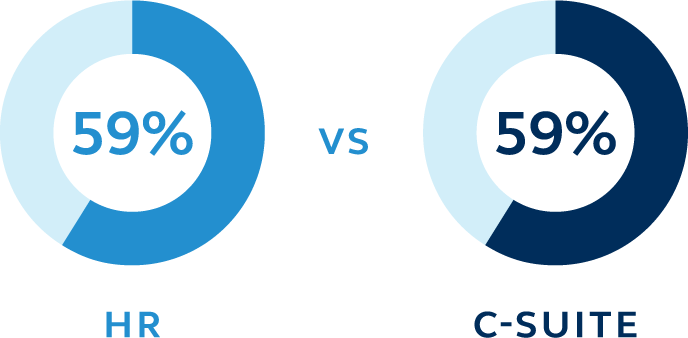
Under-informed about their plan's QDIA option
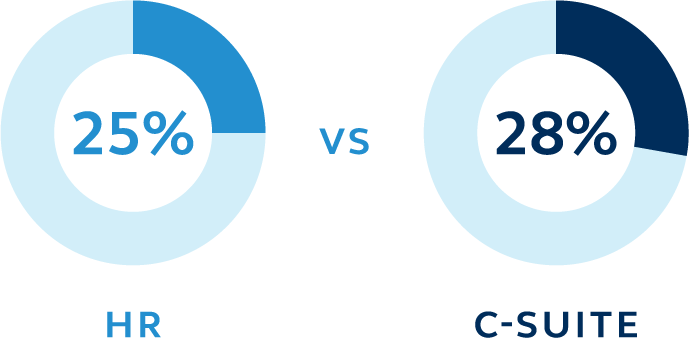
Takeaway: People in both roles have a common understanding of employees’ needs—take the opportunity to educate on and underscore the importance of the plan’s QDIA.
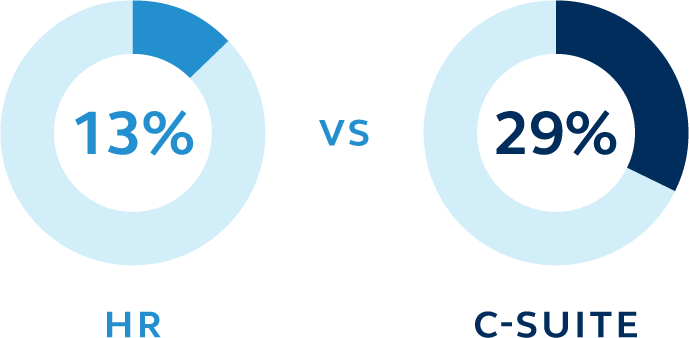
C-suite focuses on the big picture
Optimism that economic conditions will improve over the next 12 months:
HR
13%
C-SUITE
41%
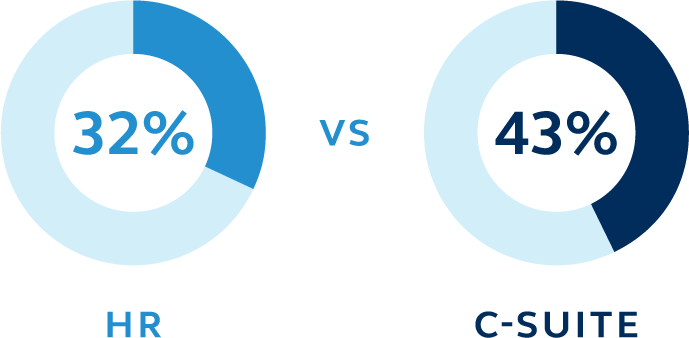
Regarding plan fees, the feeling that the company—rather than participants—should pay them:
Retirement plan success metrics are driving the C-suite’s area of focus more than HR:
Takeaway: Be cognizant of the different outlook on economic conditions and share any insights you might have. Know who makes the fee decisions—and who influences them—and tailor your approach accordingly. And add more focus to improving plan metrics when talking with the C-suite.
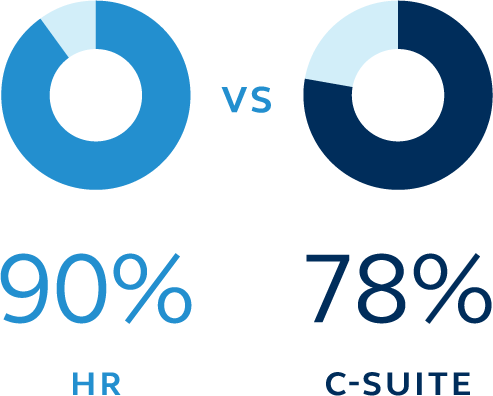
Perspective from the frontline: HR feels the heat on talent retention/acquisition
HR reports:
More concern for increased competition for talent:
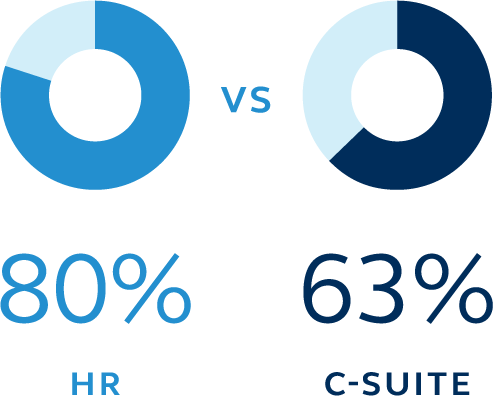
Struggling to find qualified candidates:
Experienced more turnover:
And they’re more worried about COVID-19’s impact on participants’ saving and investing decisions:
HR
C-SUITE
63%
Takeaway: Both groups are concerned, but HR is clearly on the front lines of these issues. Reinforce the positive power of retirement benefits when it comes to recruiting and retention, especially with HR. The C-suite may be interested in strengthening the retirement offering, too, so make sure to touch on how a stronger plan will likely have better success metrics.
New investing choices—and the reservations
Investing choices
Issue
Responses are shown in order of the largest difference between HR and C-SUITE for each investing choice
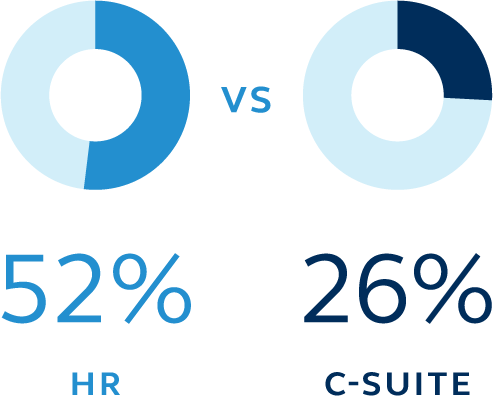
Hesitancy to adopt: I don't know enough to add it to our lineup
HR
45%
C-SUITE
26%
Hesitancy to adopt: cost
HR
25%
C-SUITE
37%
Guaranteed income
Hesitancy to adopt: foresees limited use
HR
38%
C-SUITE
45%
Hesitancy to adopt: fiduciary liability
HR
29%
C-SUITE
36%
ESG
General knowledge
HR
12%
C-SUITE
26%
Hesitancy to adopt: cost
HR
25%
C-SUITE
54%
Managed accounts
Hesitancy to adopt: foresee limited use
HR
53%
C-SUITE
42%
General knowledge
HR
32%
C-SUITE
41%
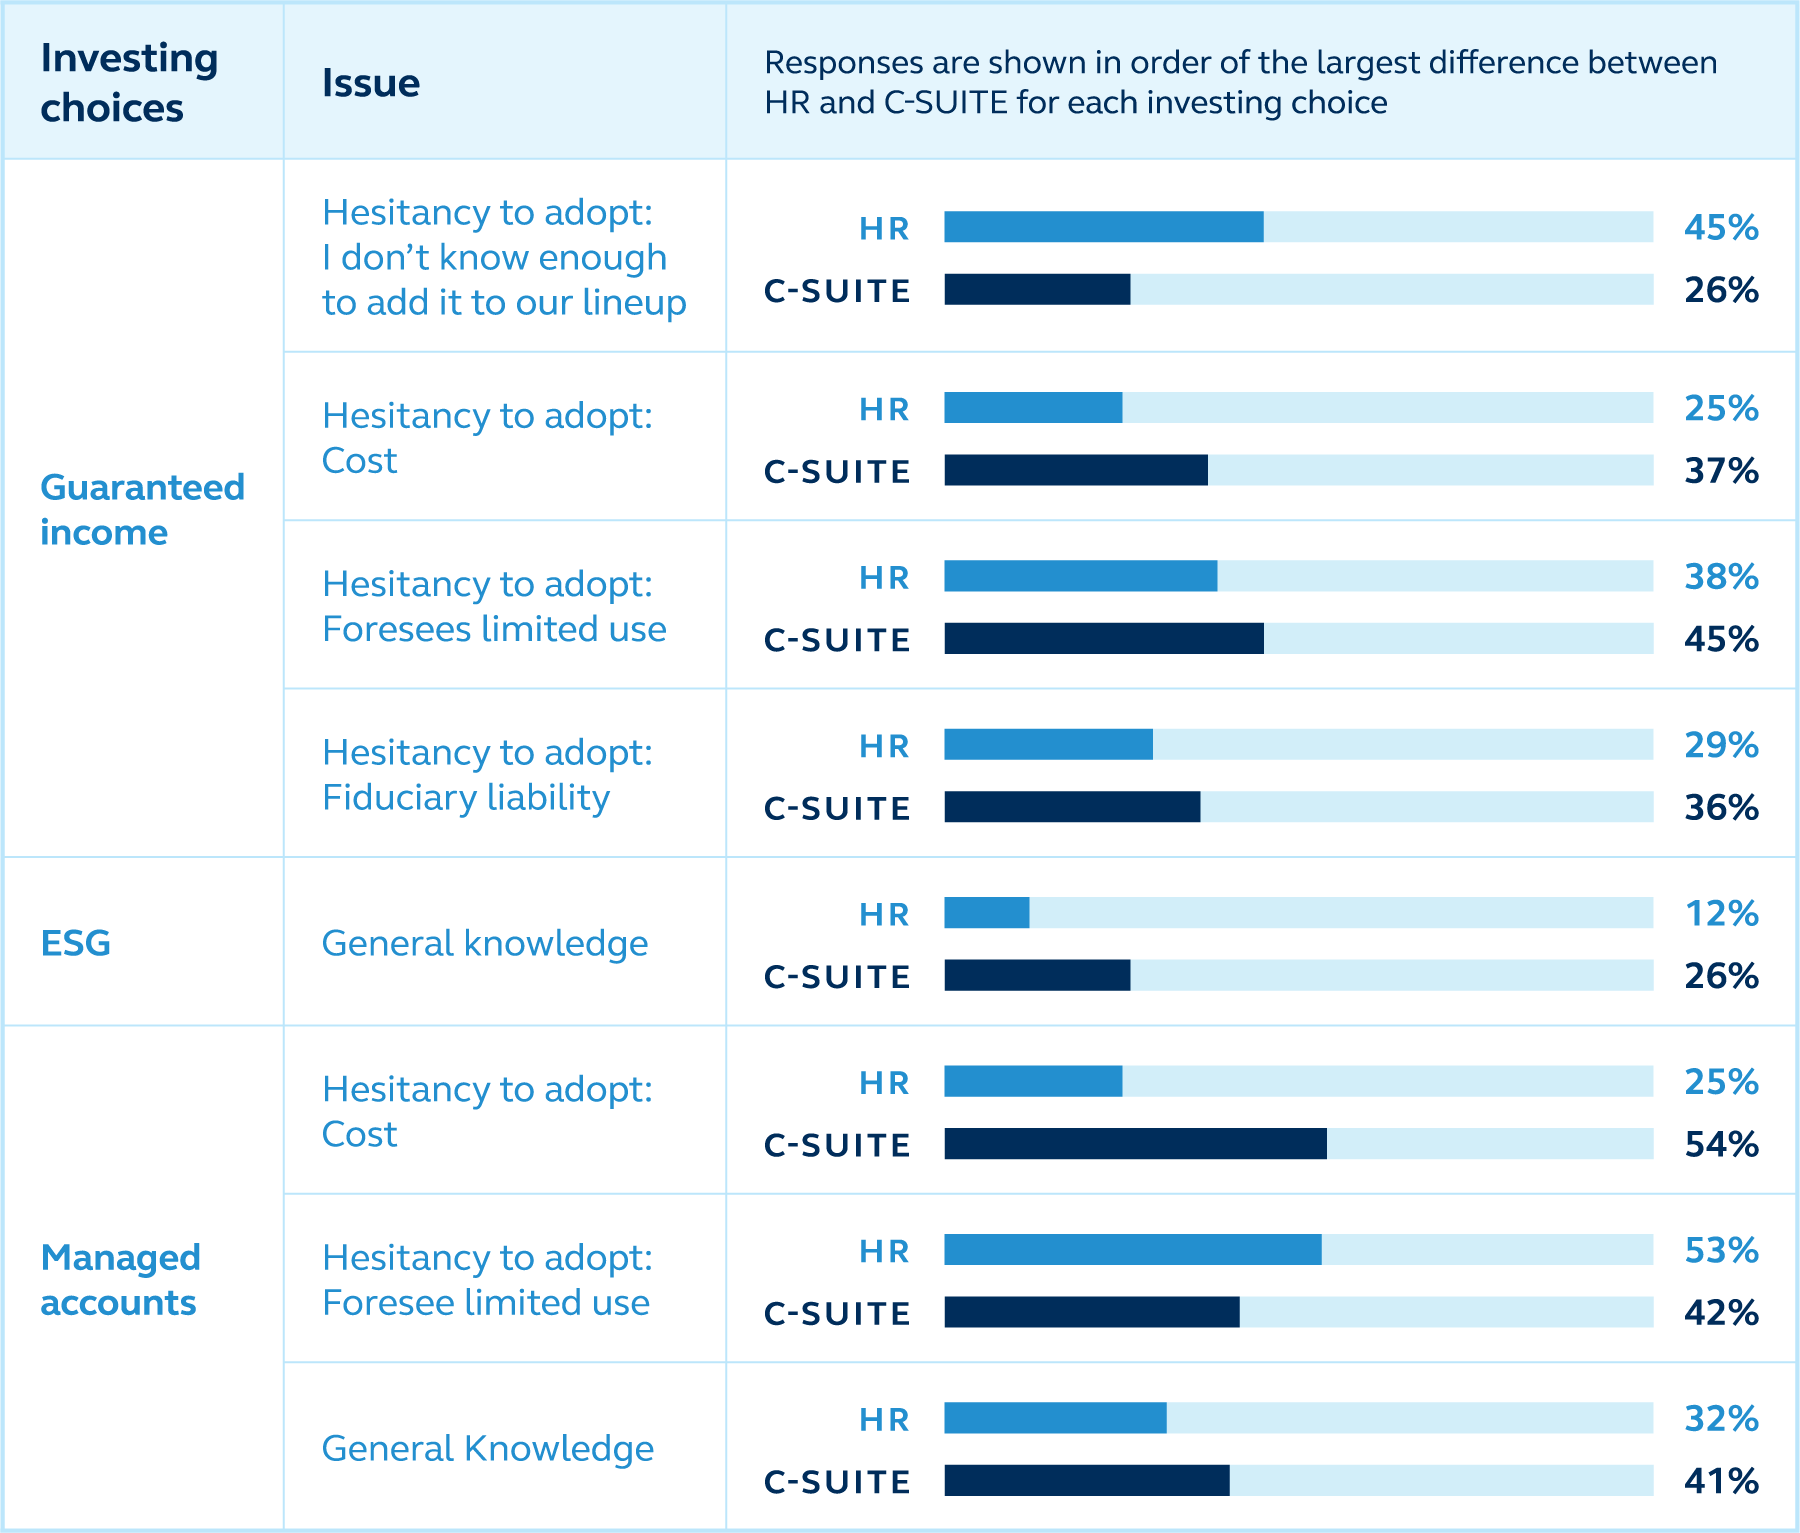
Takeaway: General knowledge of these investing choices needs a boost. Help your client understand the purpose—and the demand—for them. Remind your clients to keep employee demographics in mind. Both managed accounts and guaranteed income are likely to appeal more to those with an older employee base.
Opinions differ on the participant education needs
Topic
Responses are shown in order of the largest difference between HR and C-SUITE
Rolling in prior retirement savings
HR
34%
C-SUITE
7%
Increased financial literacy
HR
61%
C-SUITE
37%
Increasing deferral
HR
39%
C-SUITE
20%
Retirement planning/mid-career actions
HR
54%
C-SUITE
35%
When to open additional retirement savings account/IRA
HR
34%
C-SUITE
17%
When to reallocate savings
HR
58%
C-SUITE
43%
Inflation's impact on retirement
HR
29%
C-SUITE
15%
Selecting investments
HR
56%
C-SUITE
46%
Knowing when to retire
HR
34%
C-SUITE
26%
When/how to plan retirement income
HR
42%
C-SUITE
37%
Options with retirement savings upon job change
HR
24%
C-SUITE
19%
Increasing investment knowledge
HR
59%
C-SUITE
59%
Takeaway: HR has stronger feelings about the education needs of employees, centering on financial wellness and investments. Know your audience and touch on the topics they find necessary—unless you feel you need to educate and advocate for something missing in their plans’ education program.
What's driving them to focus on the retirement plan offering?
Topic
Responses are shown in order of the largest difference between HR and C-SUITE
Cost to the organization
HR
31%
C-SUITE
49%
Helping employees achieve financial security
HR
73%
C-SUITE
57%
The impact of COVID-19 on employees
HR
17%
C-SUITE
4%
Feedback from employees surveys
HR
14%
C-SUITE
2%
Employee demographics
HR
32%
C-SUITE
22%
The increase of hiring new employees
HR
25%
C-SUITE
19%
Increase in employees leaving/retiring
HR
14%
C-SUITE
8%
Takeaway: The great news here is that employee financial security drives both groups with the highest response. But differences abound and the issue of cost fits nicely in the C-suite’s focus on the bottom line and program metrics. Conversely, HR’s proximity to all employees drives their attention to the people impacted, as shown by more focus on demographics, employee feedback, and worry about the impacts of COVID-19. Consider what might be motivating your contact and hit those points to better meet their needs.
Next steps
Resources to use with clients:
We’re here to help you be successful in the overarching goal to help people achieve financial security. Starting with market intel and understanding your clients’ motivations can improve your recommendations.
- Principal® Business Needs Assessment
- Principal® Benefits Design Tool
- Retirement plan fee information
- Navigating business now – site to share with plan sponsor clients
For you:
As you prepare for conversations with clients or prospects, reach out to your Principal representative for additional perspective on these topics.
Fore more client insights, bookmark our Principal® retirement research and thought capital site.
* All data presented here, unless noted, is from the Principal® Retirement Security Survey, Plan Sponsor Results, September 2021 (Q3).
Principal®, Principal Financial Group® and the Principal logo design are registered trademarks of Principal Financial Services, Inc., a Principal Financial Group company, in the United States and are trademarks and service marks of Principal Financial Services, Inc., in various countries around the world.
2006419-022022 | 02/2022