Recruit, reward, and retain WM team members through the right retirement plan design

Maximum Employer Contribution Comparison

We understand the importance in recruiting and retaining great team members for organizations like WM. The right retirement plan design can improve overall team member satisfaction, and reduce overall benefit expenses in the meantime.


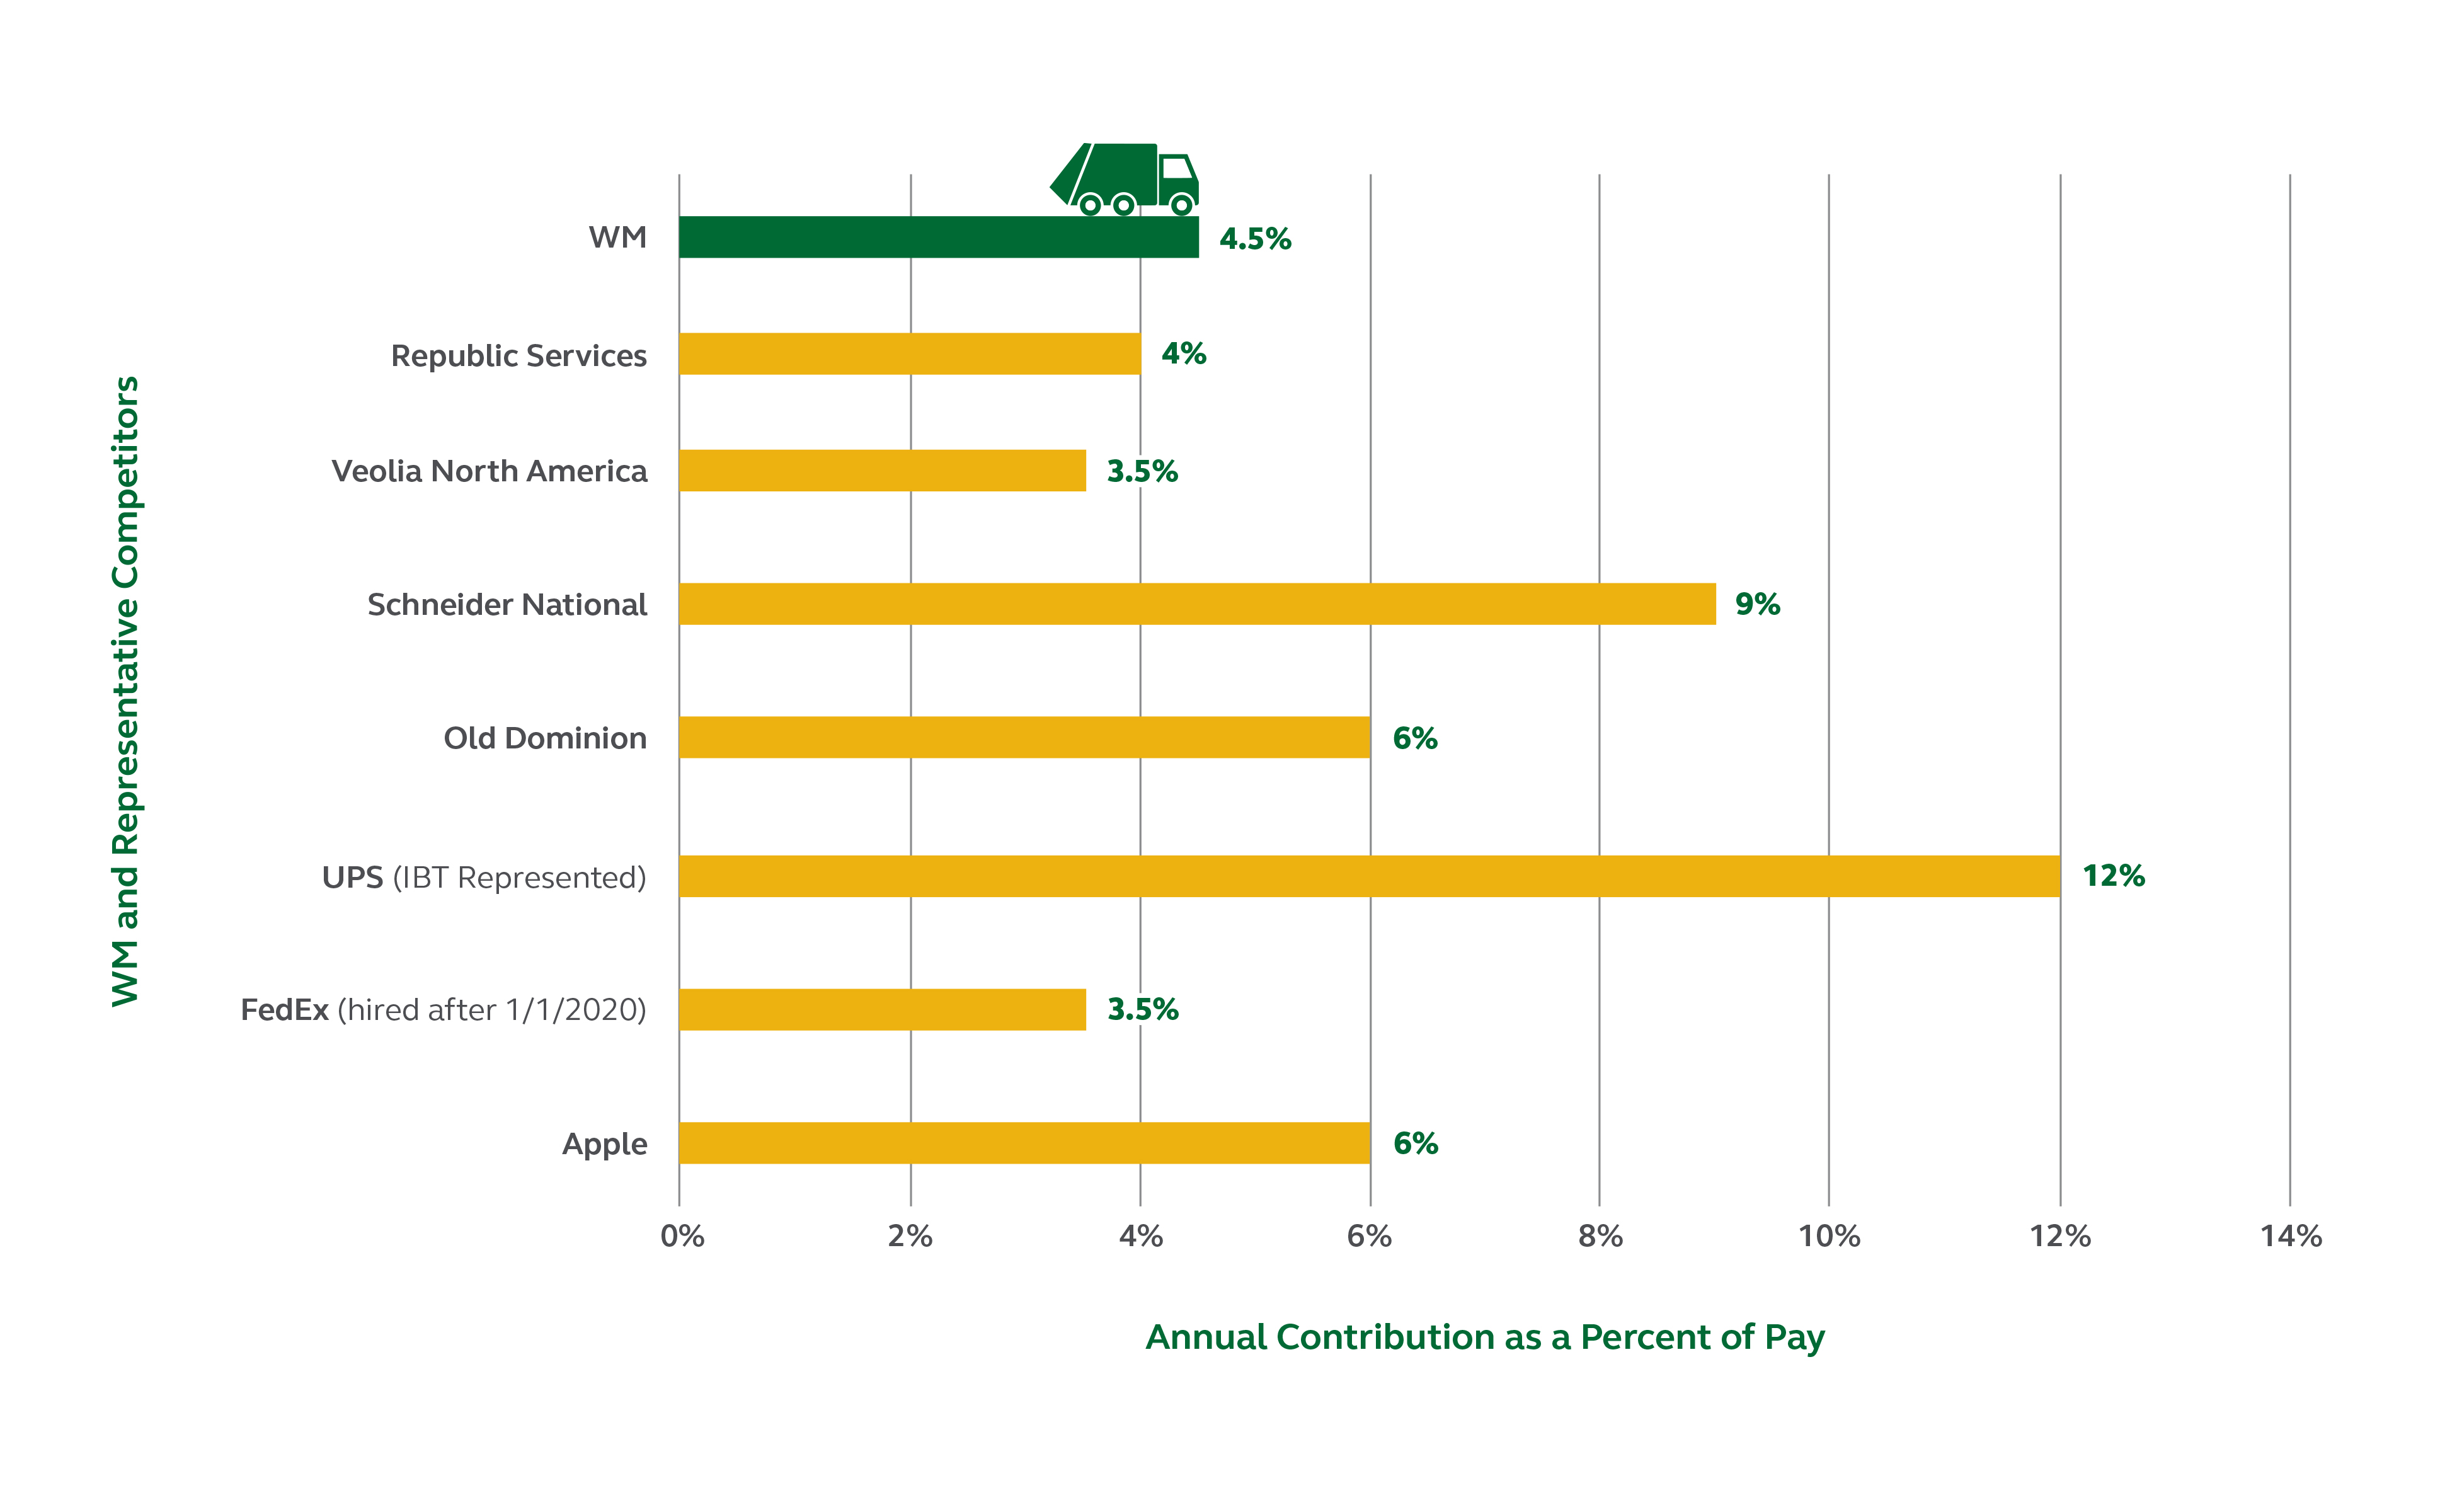
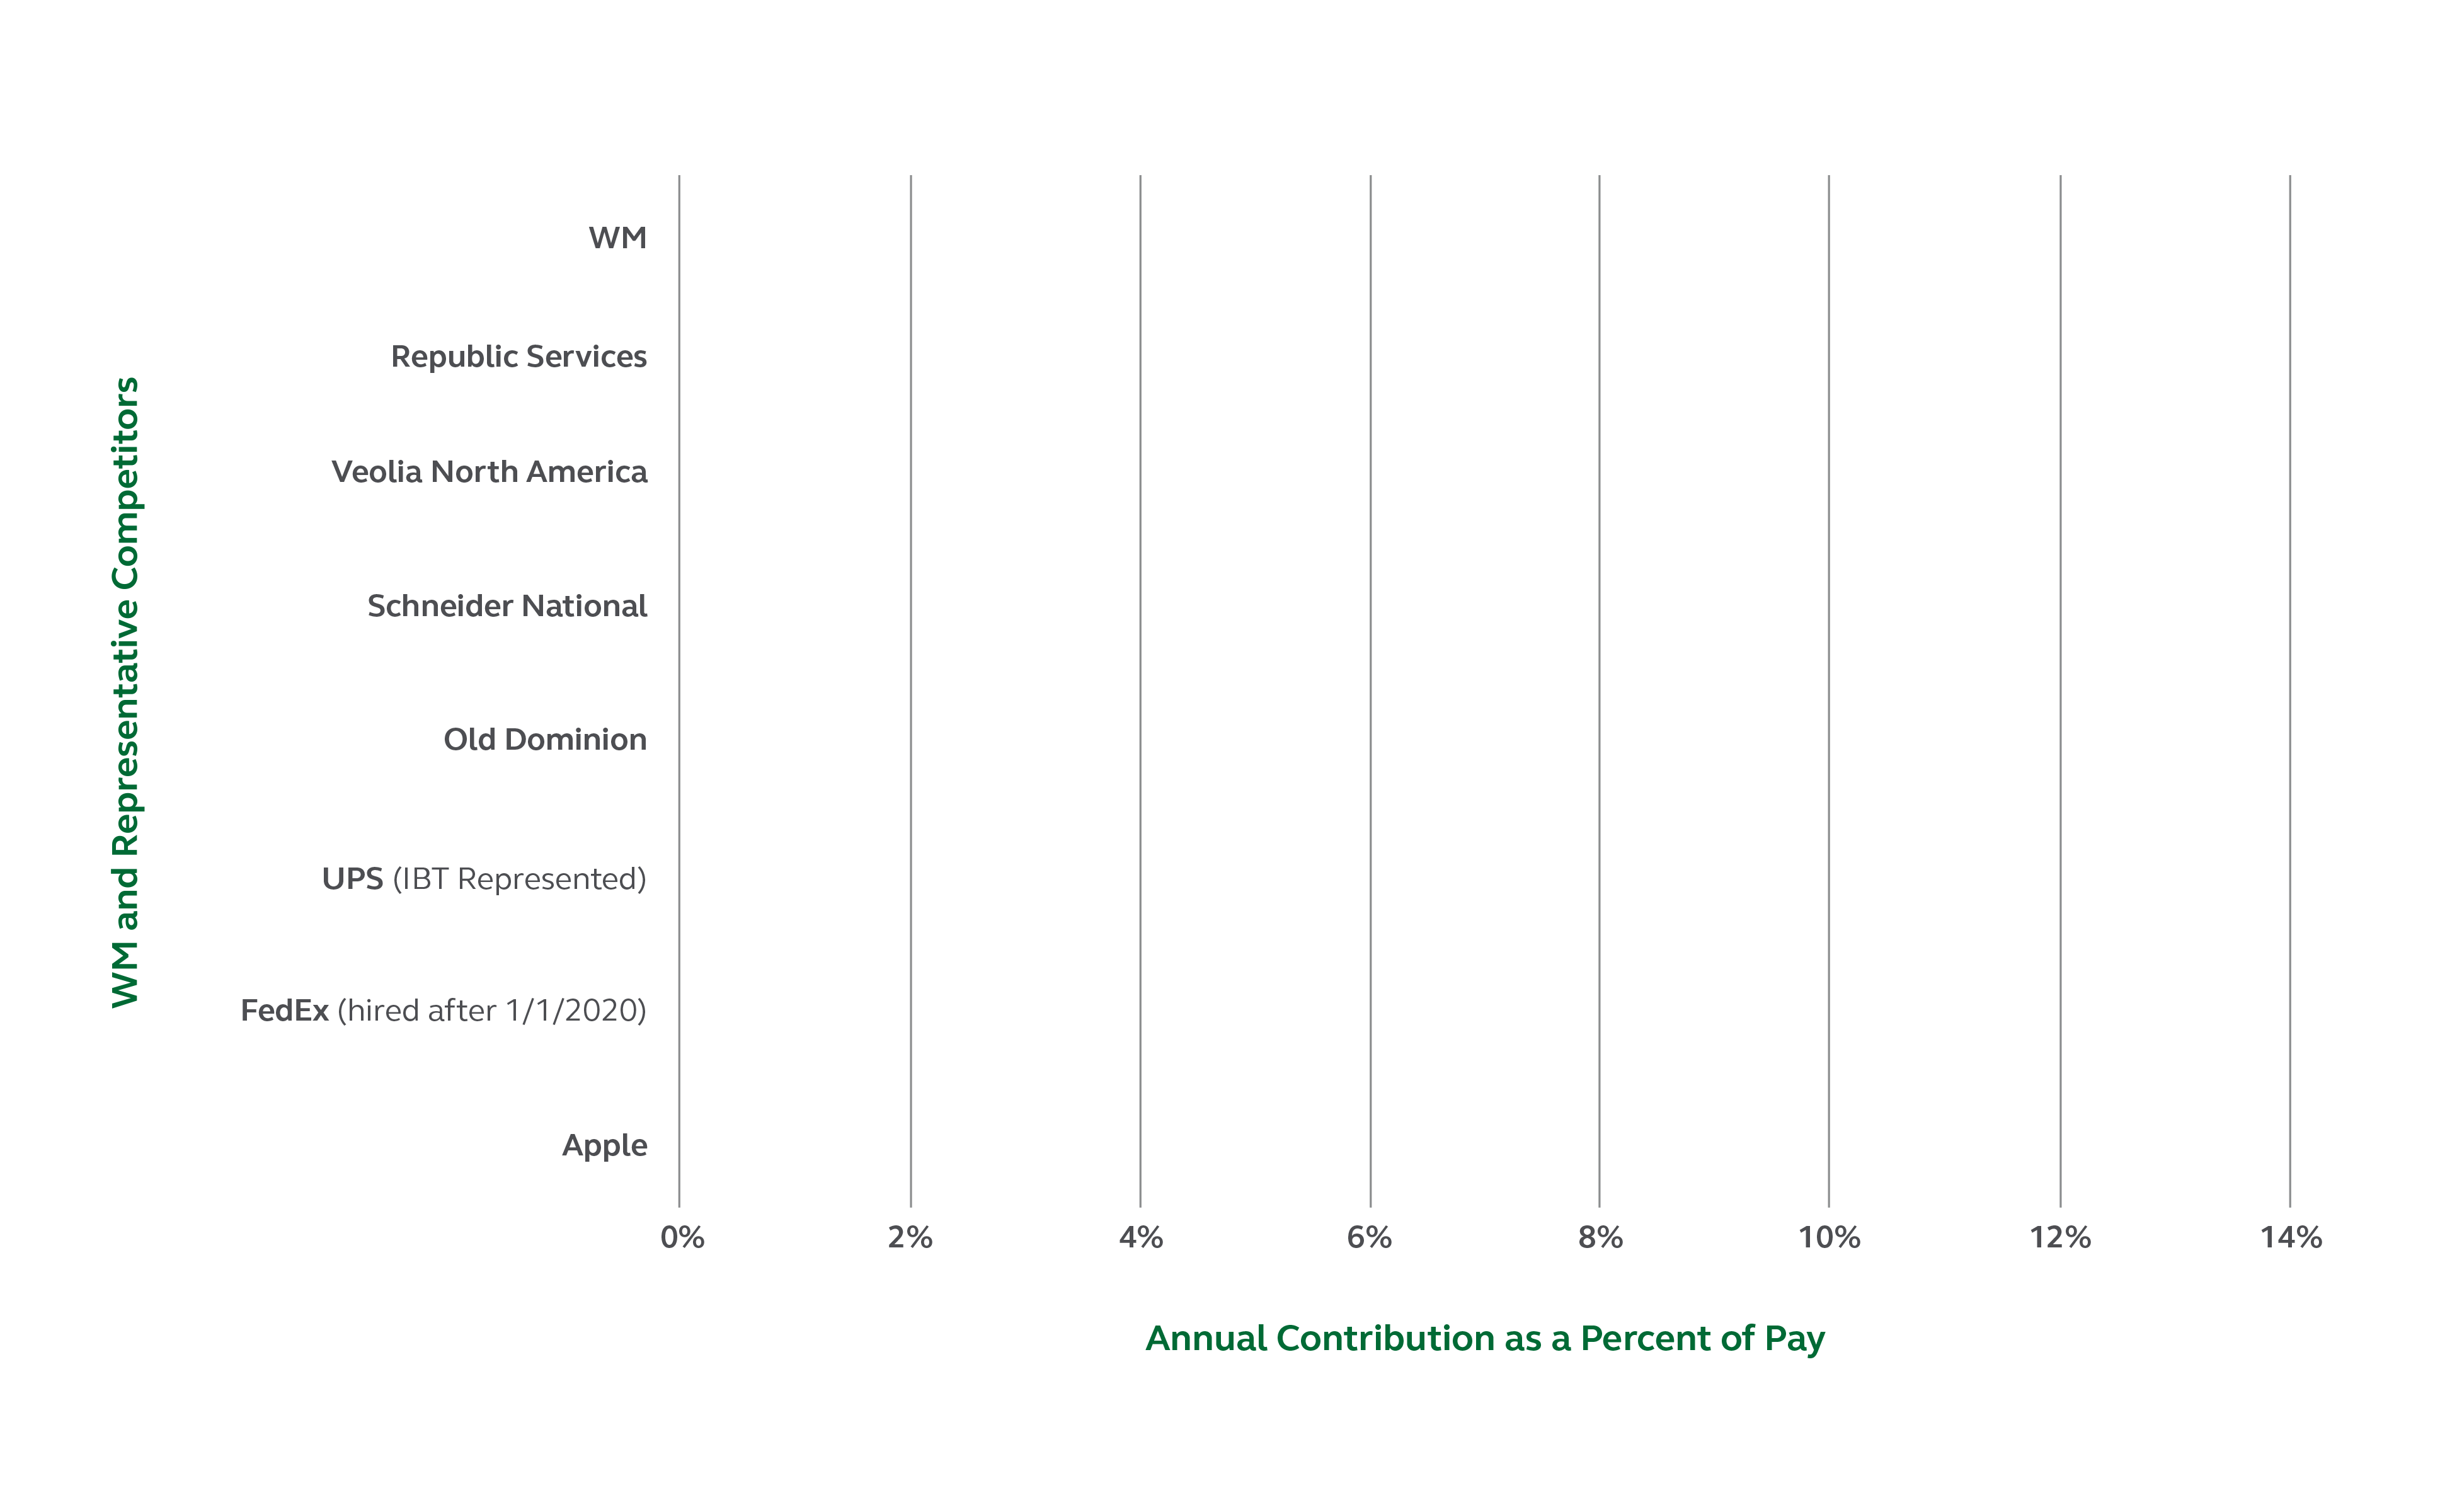
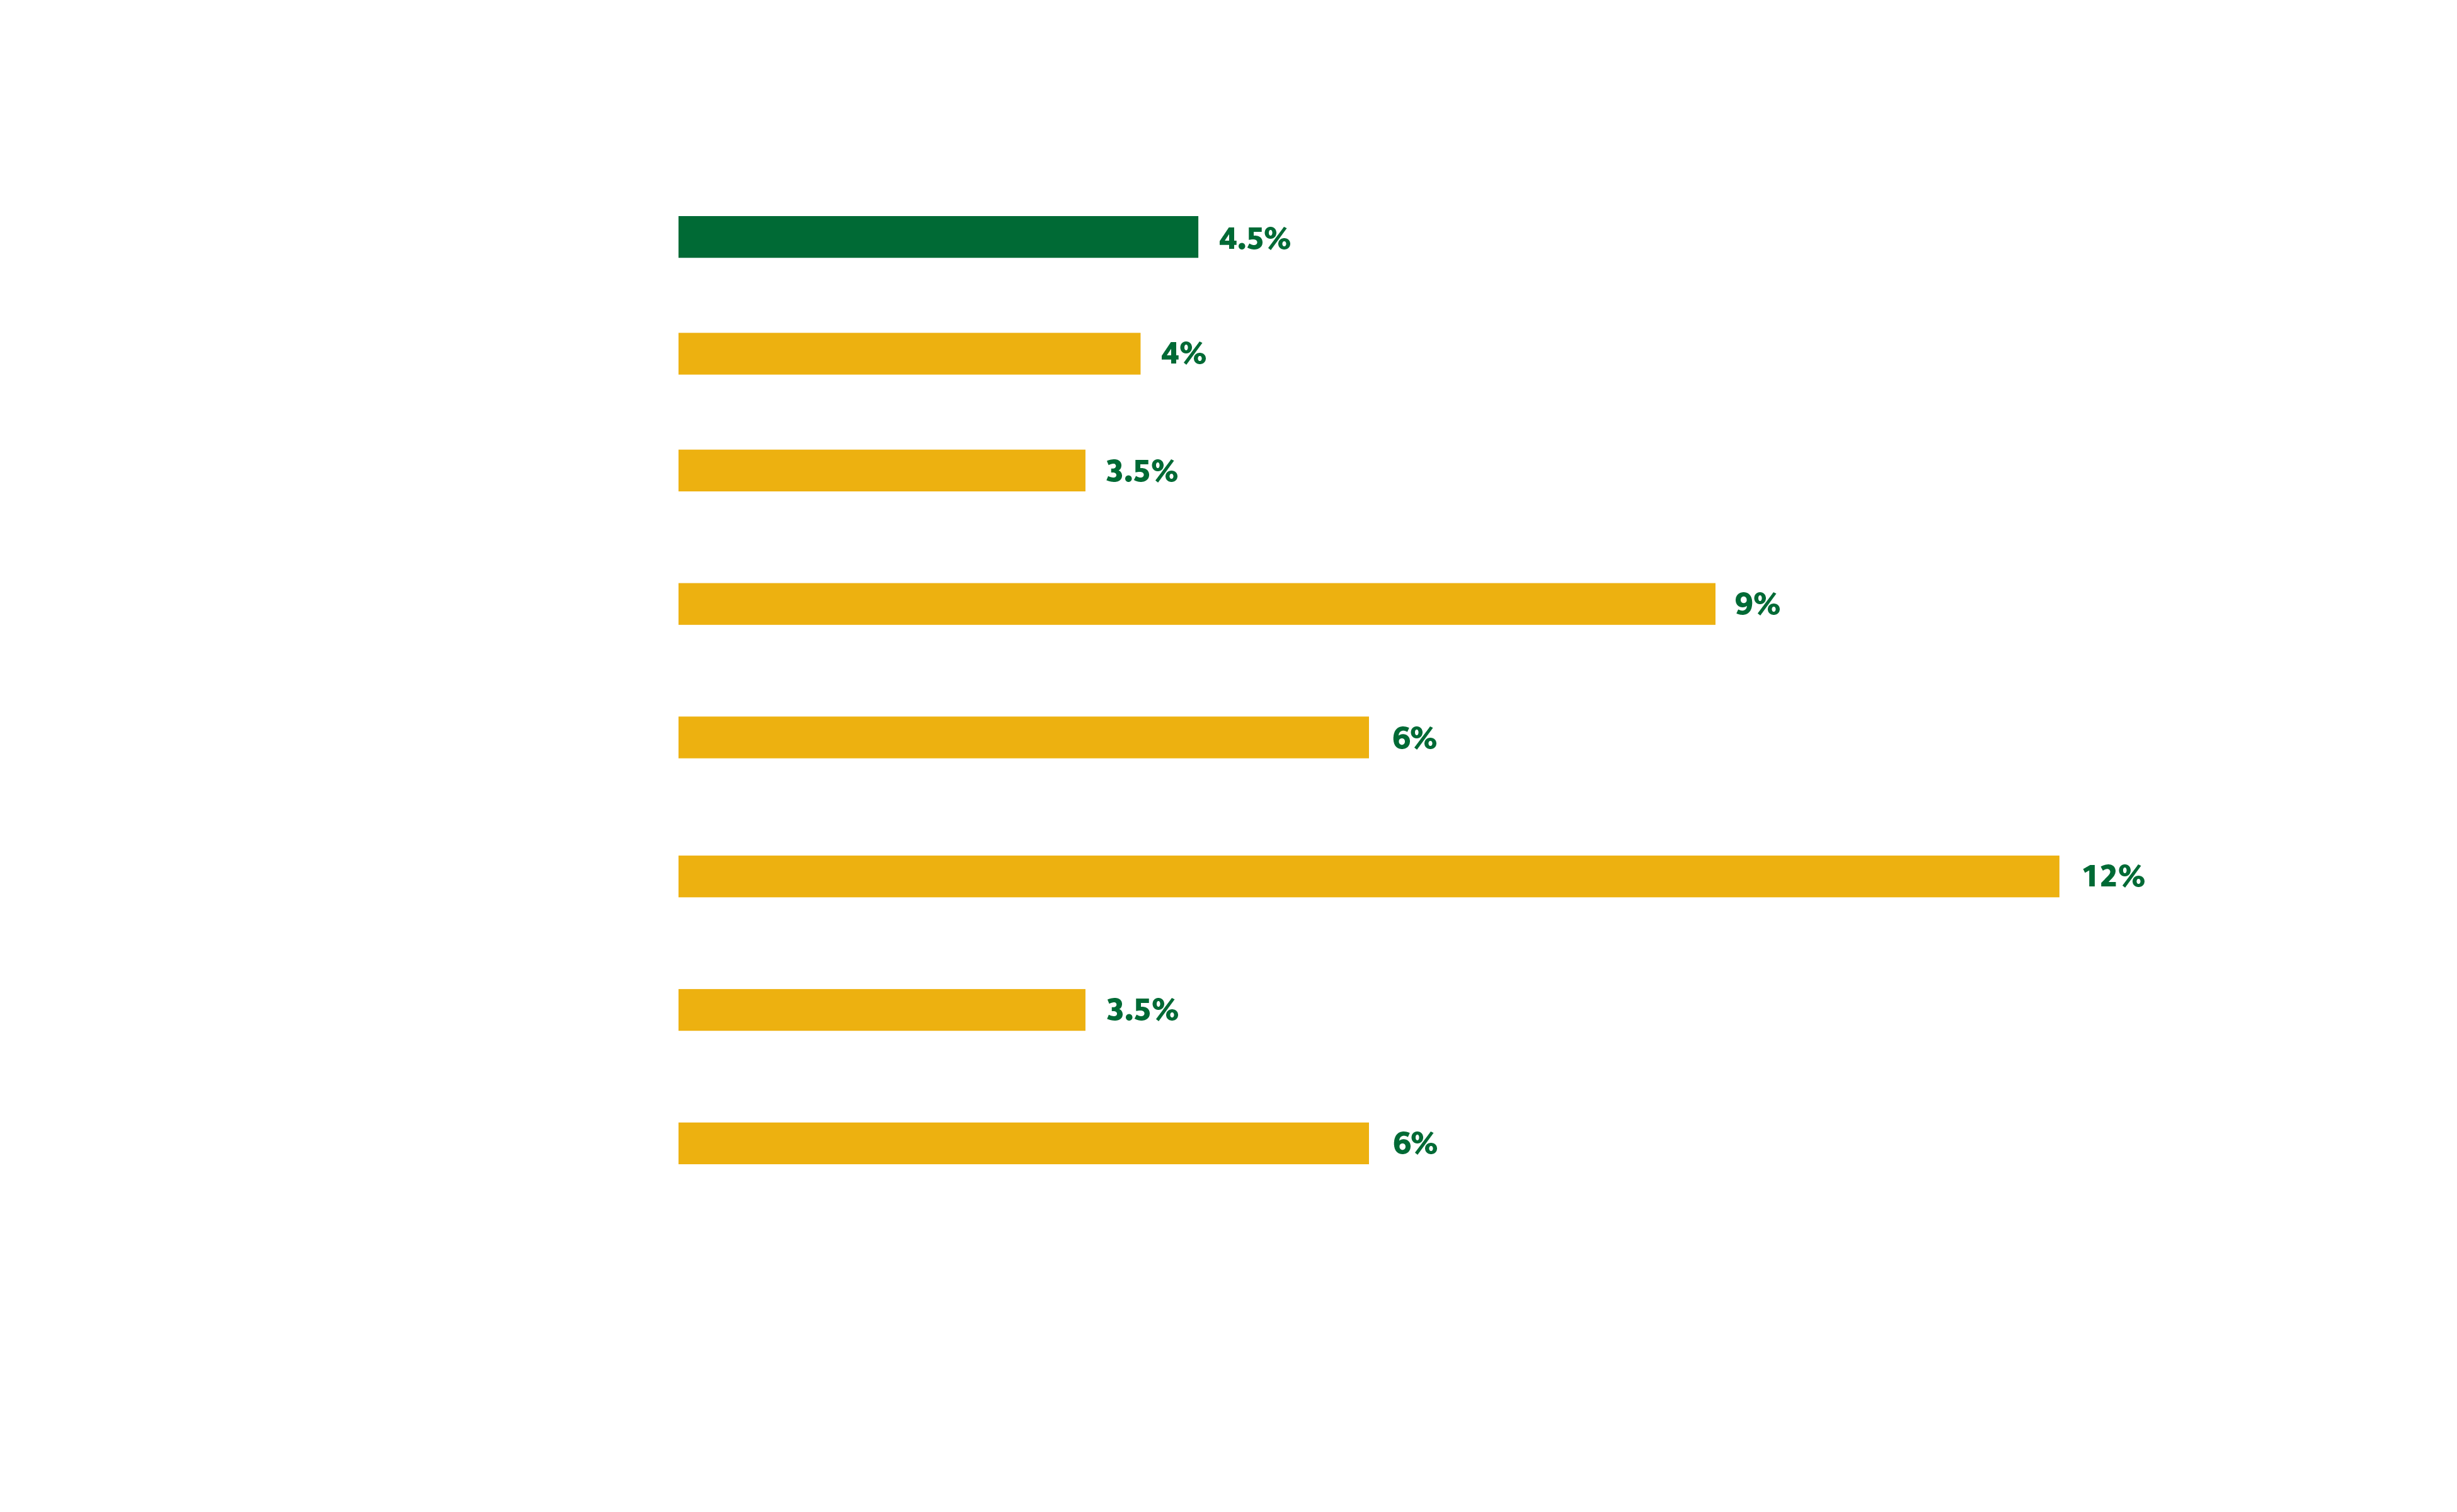
WM offers a generous benefits program to your team members, including contributions toward team member retirement plans. The graph below illustrates WM's maximum employer contribution to retirement as a percent of salary and how it compares to your competitors, both in your industry and in others who hire similar talent. (Information from most recent 5500 filings – 12/31/20)

Maximum Team Member Contribution to Retirement as a Percent of Salary

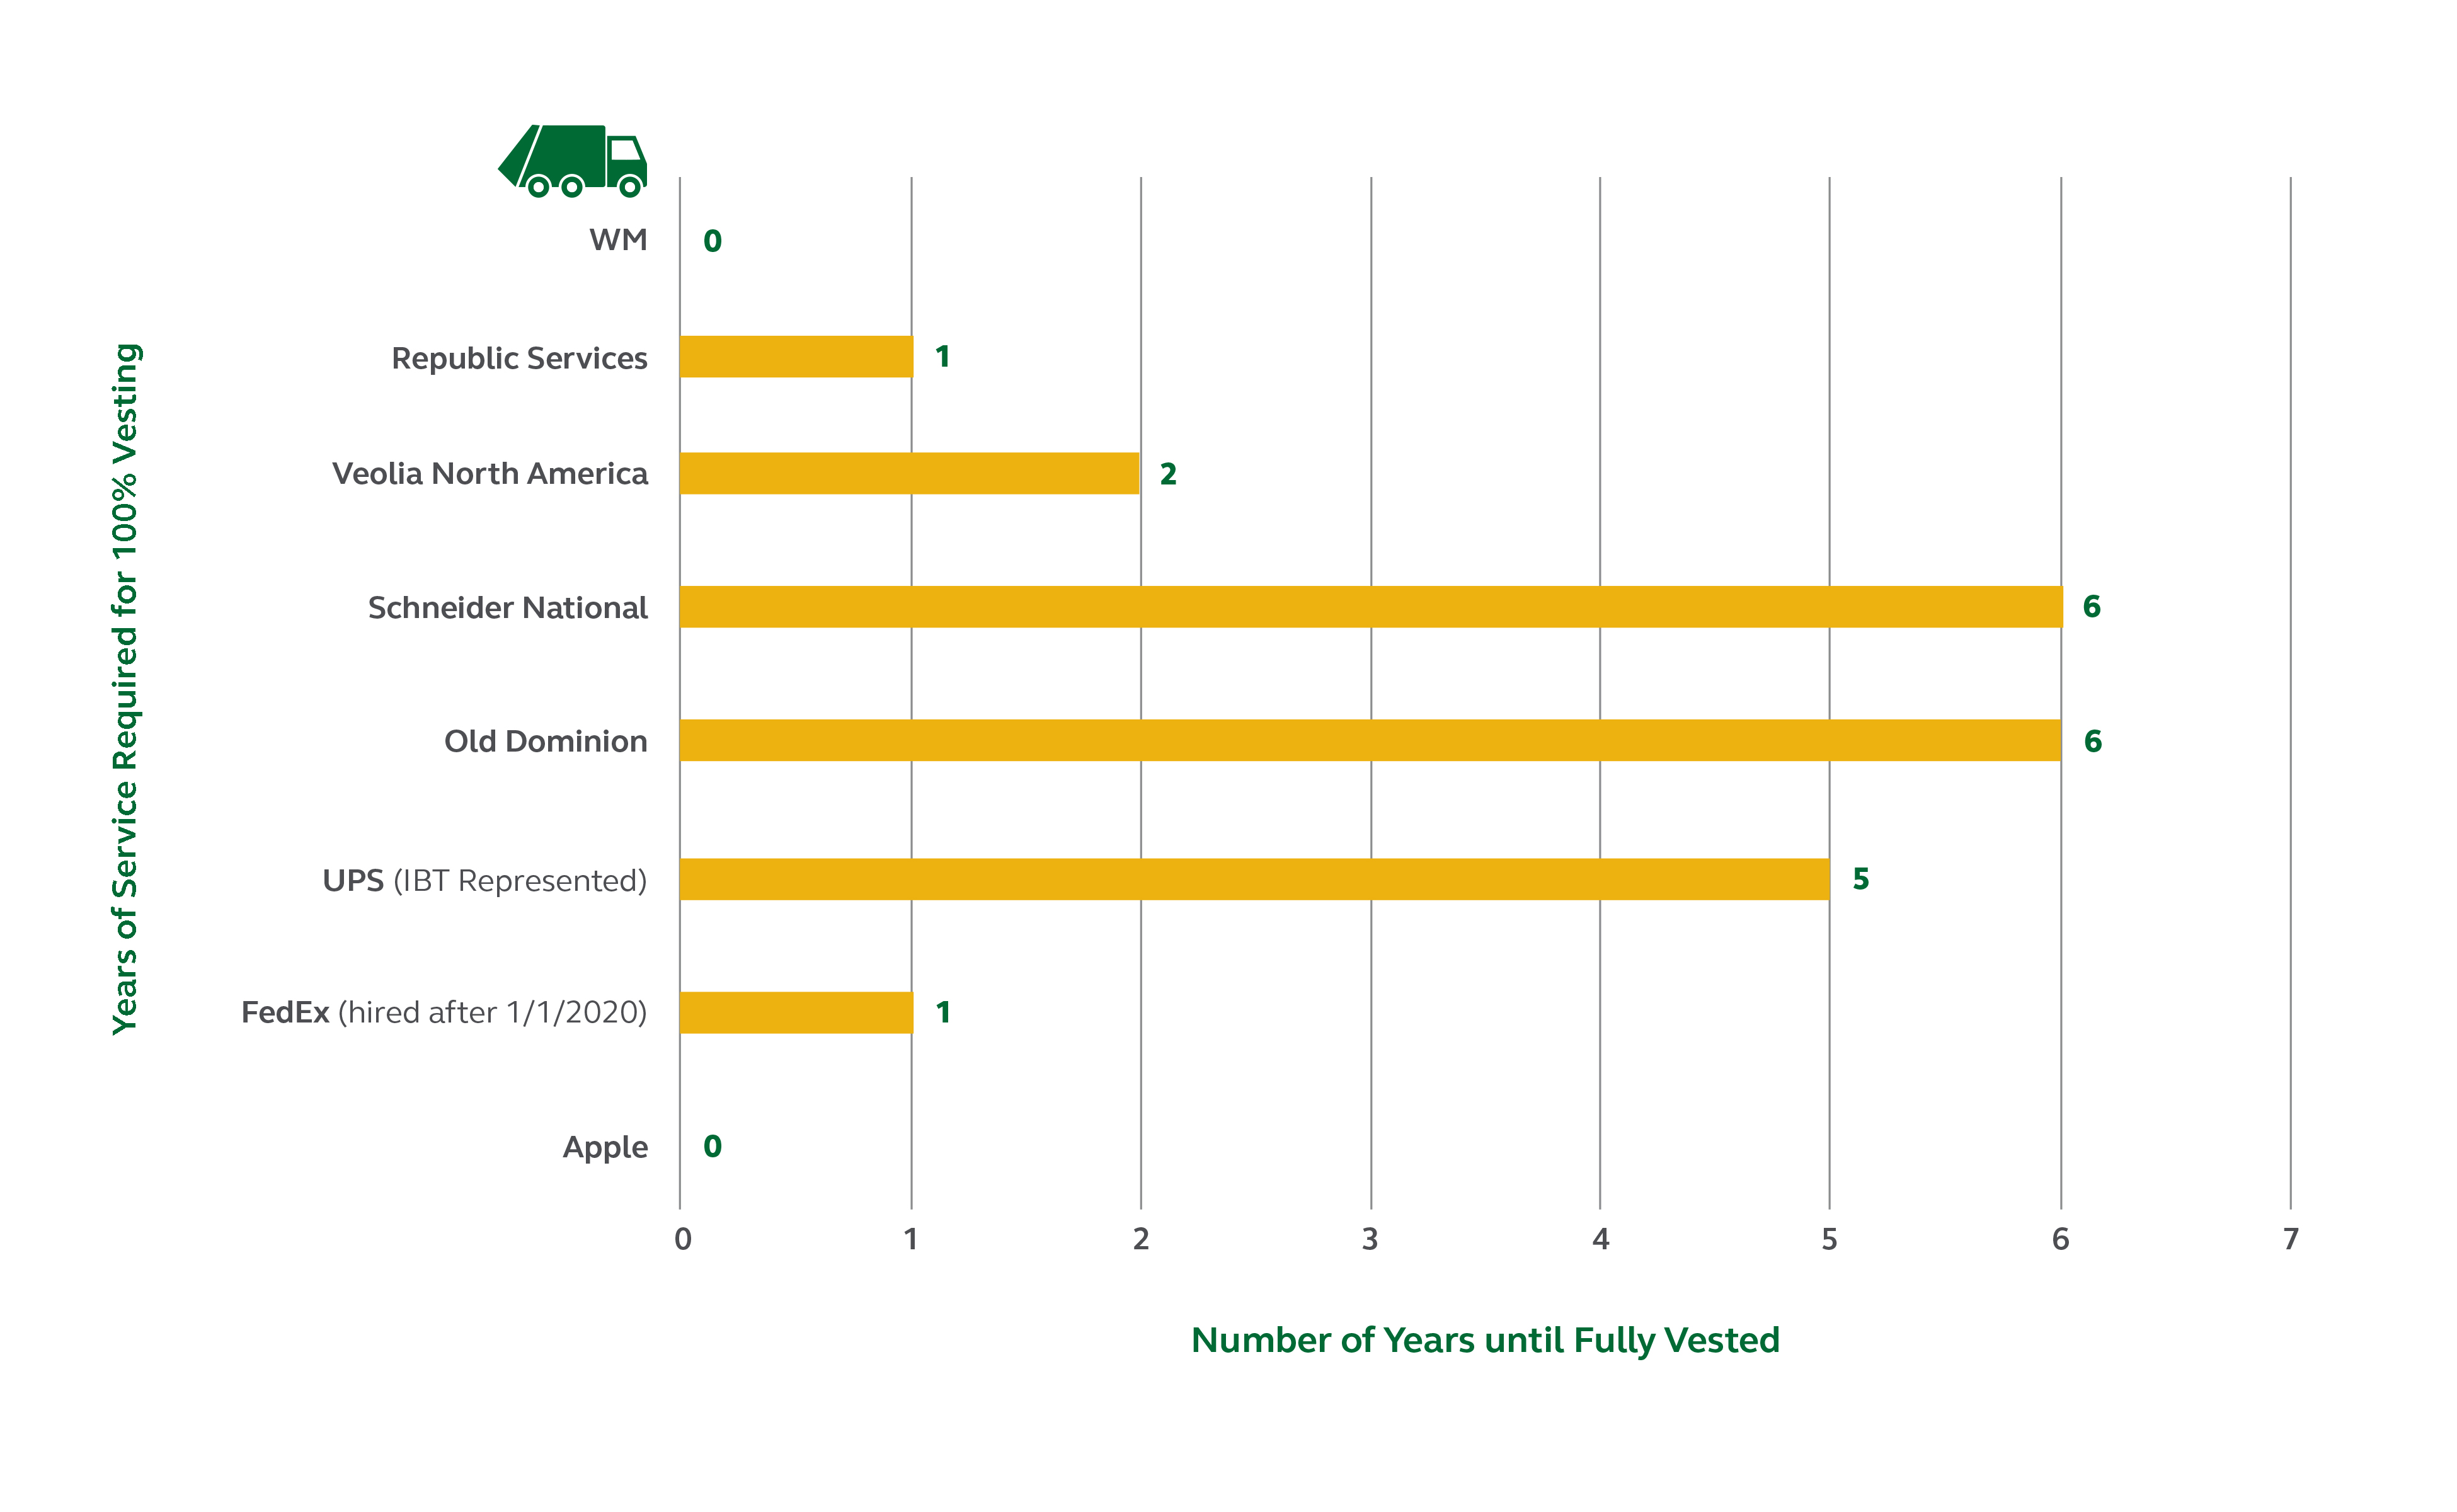
Team member match vesting comparison

WM offers a generous full vesting immediately upon employment. The graph below illustrates a comparison among competitors of the number of years until a team member is fully vested in the plan's employer contributions. WM’s immediate vesting approach is above average of nearly all competitors we've reviewed. (Information from most recent 5500 filings – 12/31/20)

Number of Years Until Fully Vested

Opportunities for team member impact

Possible opportunity for enhancement:

WM is contributing more than others in their industry, but with earlier vesting – both of which add cost to the program.

WM’s retirement program is less competitive vs those of traditional logistics firms.

WM is contributing more than others in their industry, but with earlier vesting. Both of which add cost to program

WM’s retirement program is less competitive vs those of traditional logistics firms.

Therefore, WM could improve these positions by changing your plan to a newer version of Safe Harbor. This would move the plan to a 3.5% total team member contribution with 2 year vesting and auto-escalation to 10%.


Potential impacts of such a change:

  1. Improve overall outcomes via auto-escalation and increased team member savings.
  2. Reduce overall expenses by an estimated $6-8M. This breaks out as follows:
  • $4-5M from reduction in match and,
  • $2-3M from reduction in WM money paid out with short service team members (under 2 years).

This could allow WM to redirect this estimated $6-8M cost savings to increase sign-on and retention bonus offerings for CDL drivers and other difficult-to-recruit skill sets.

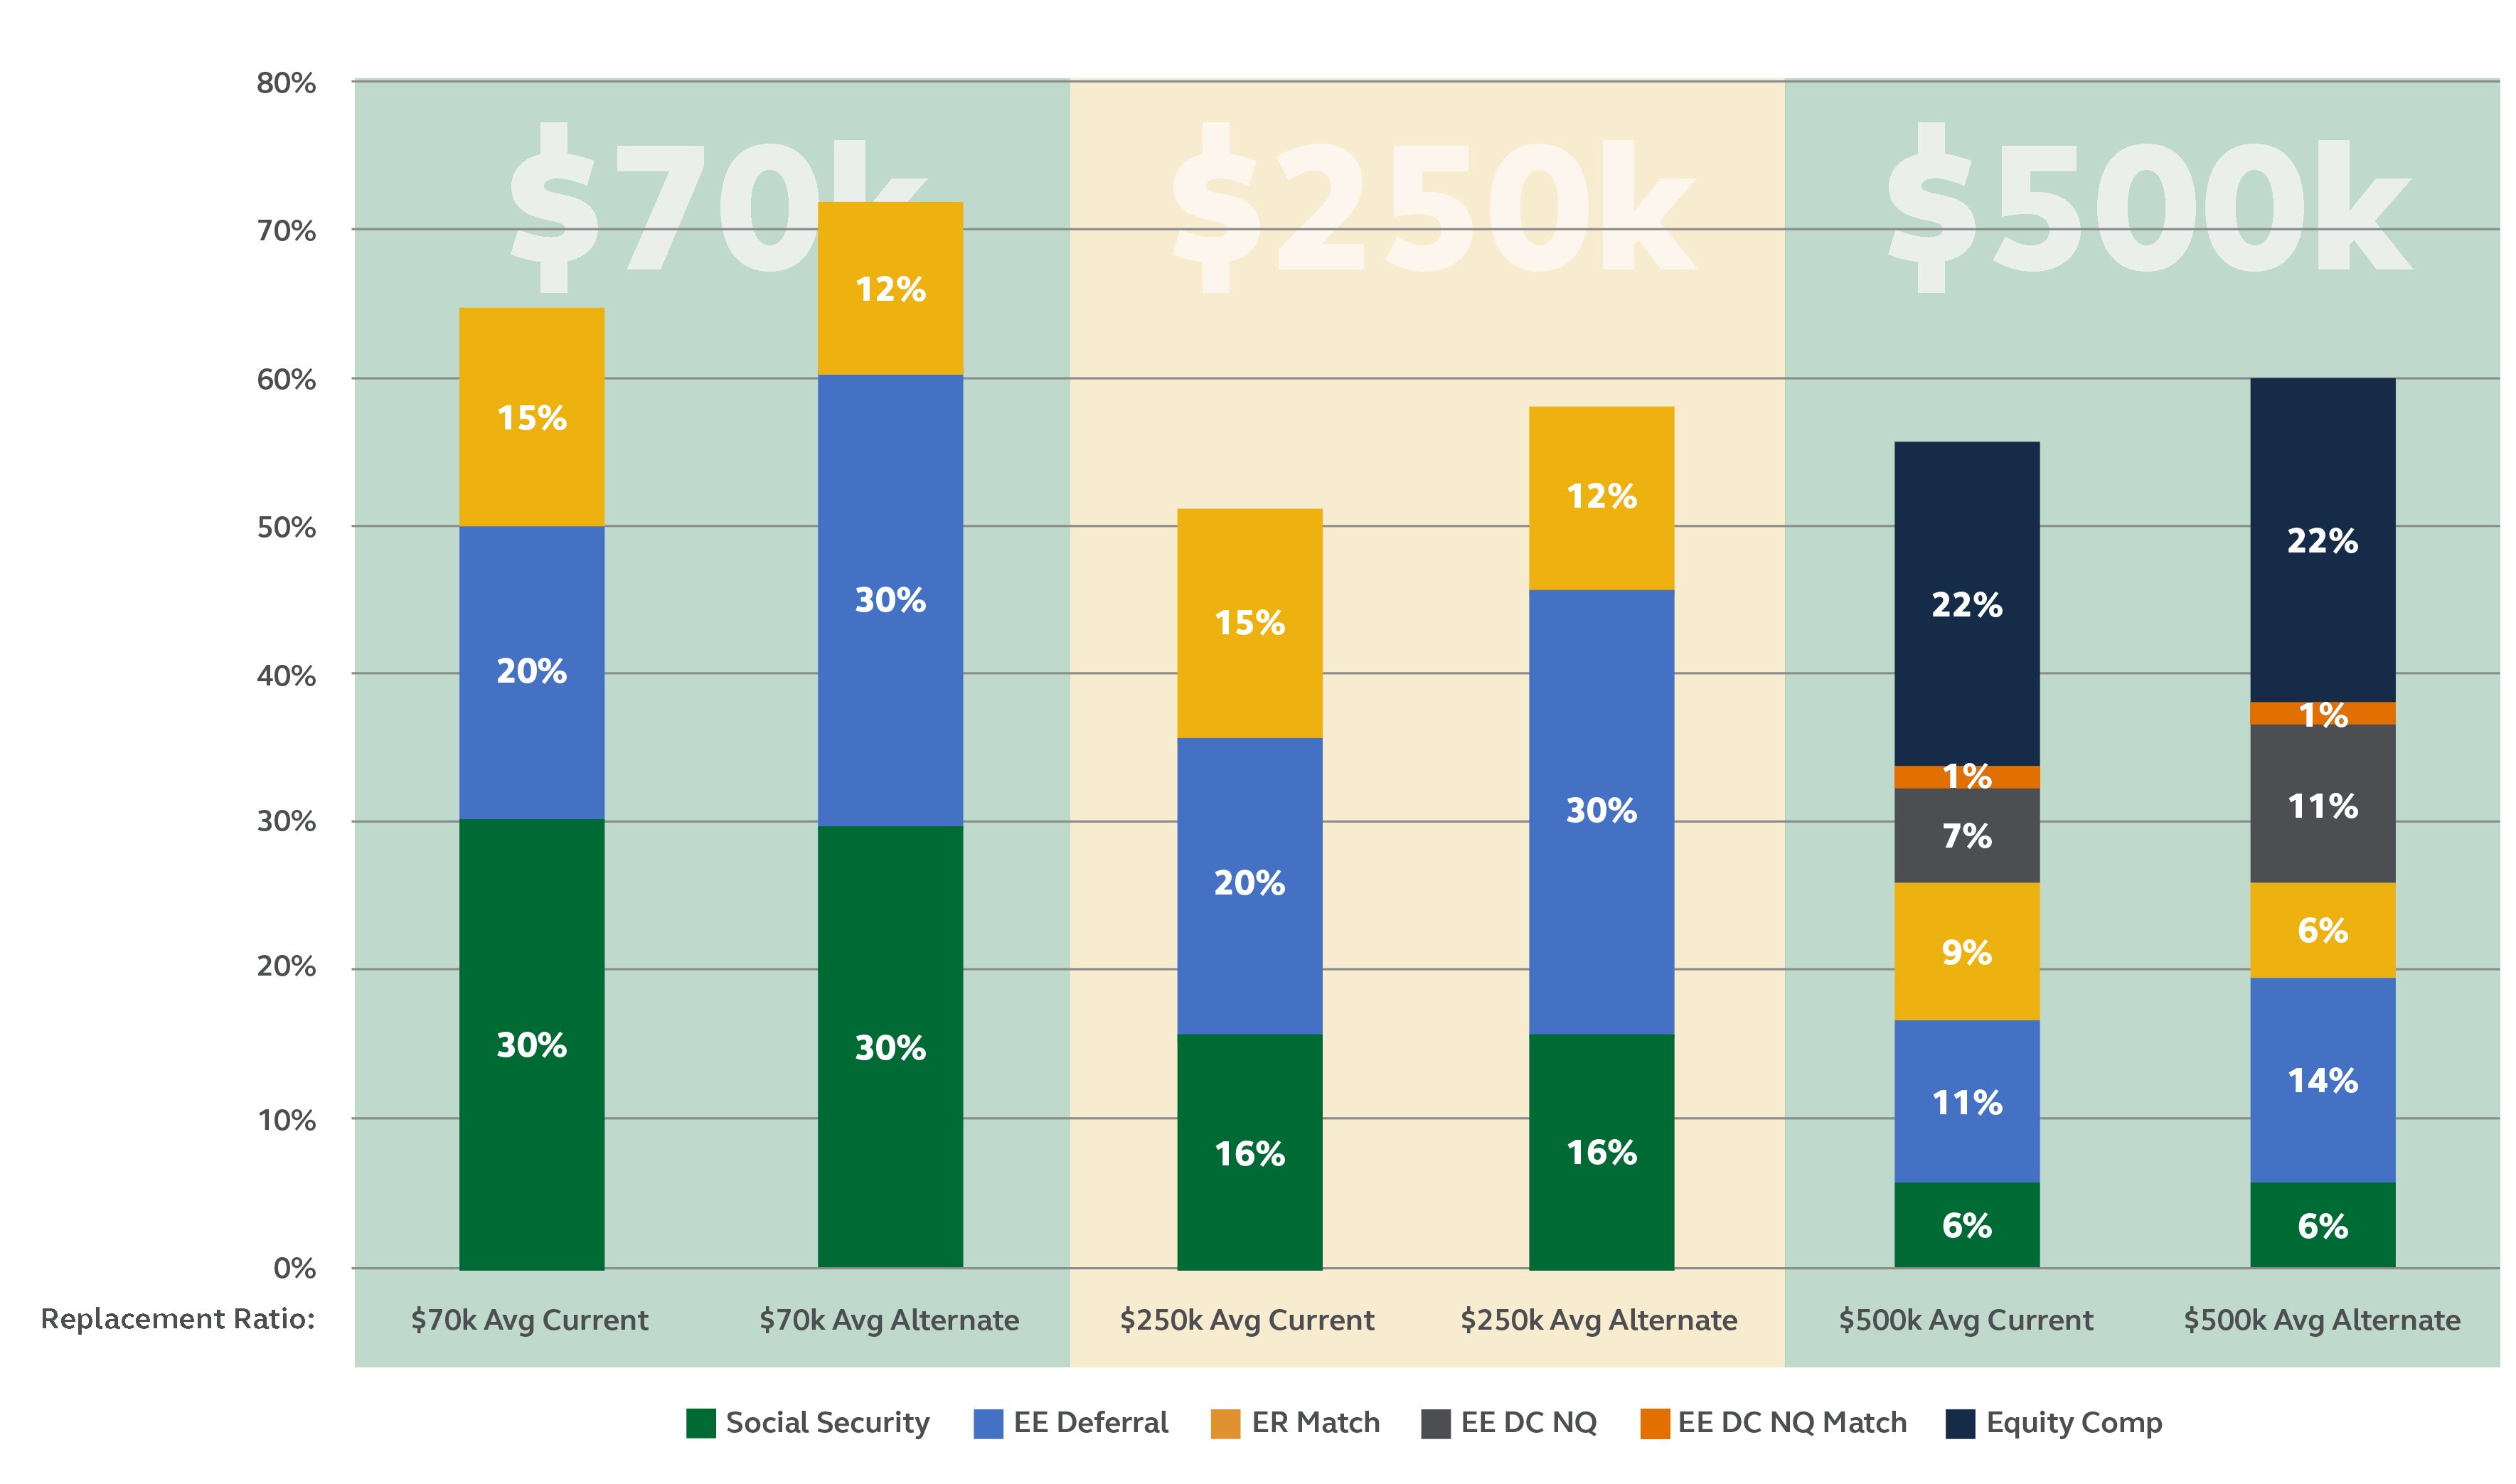
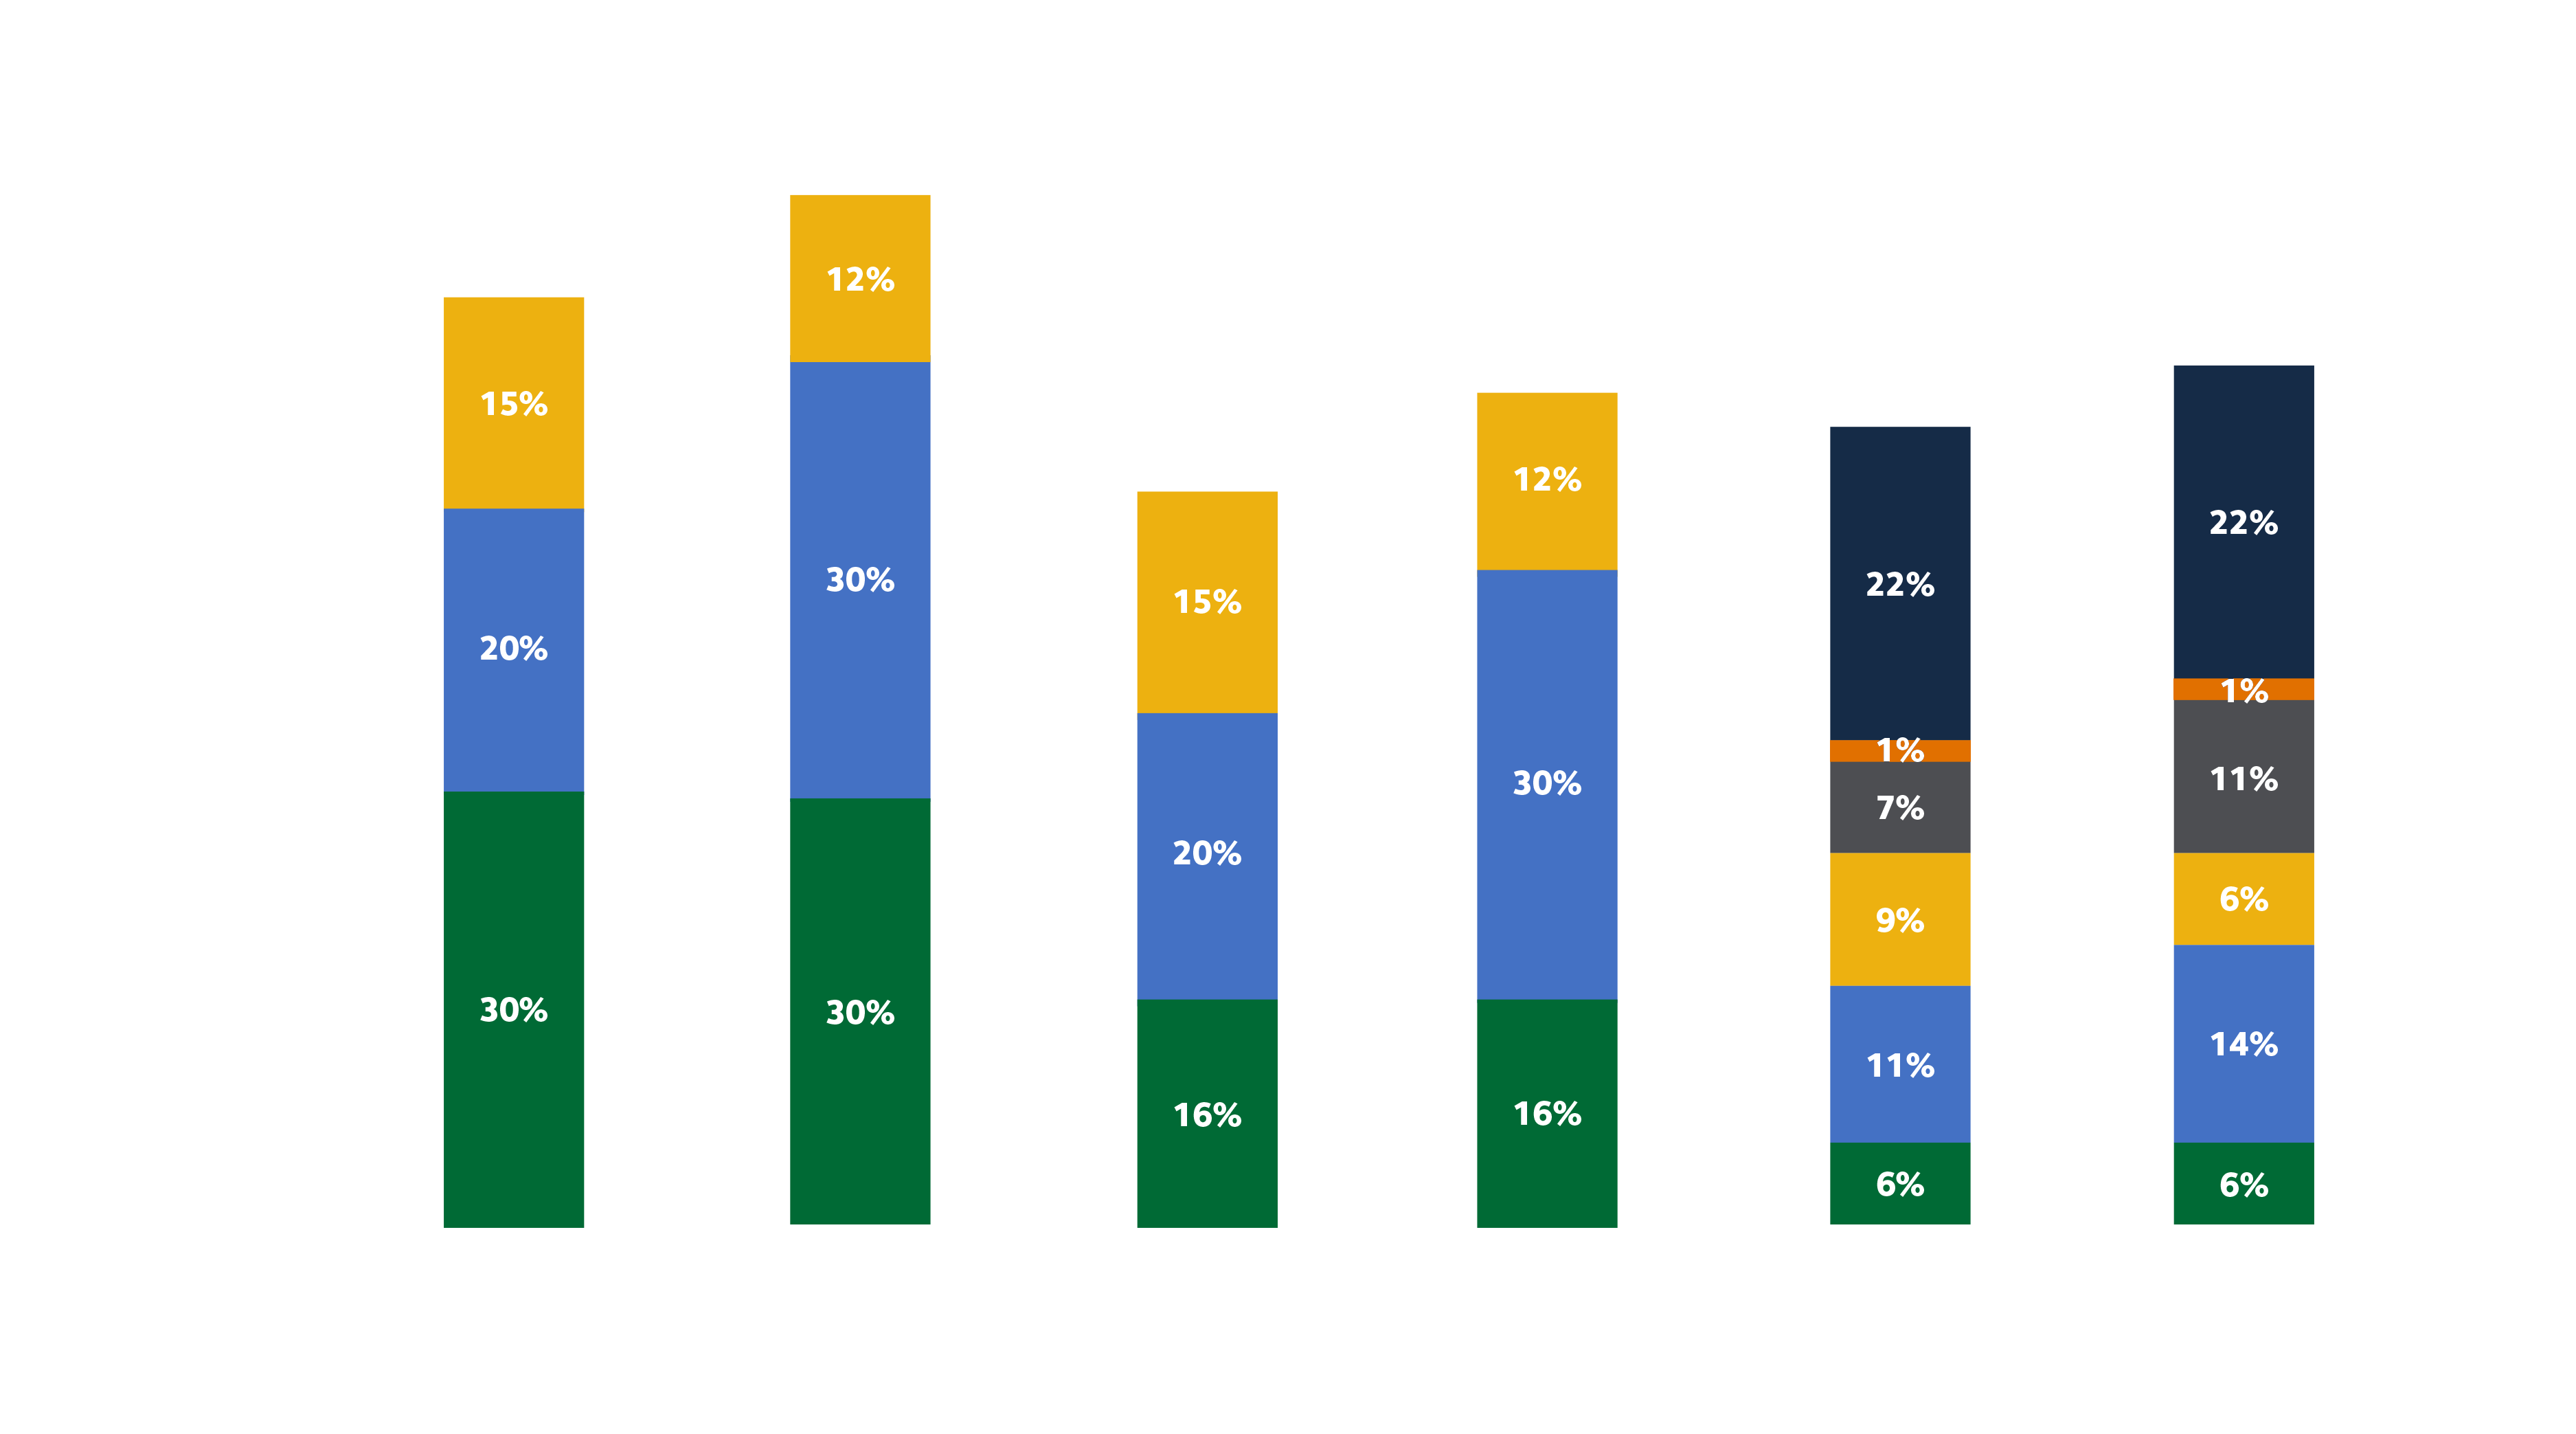
Projected Retirement Outcomes at Various Salary Levels

Of course, any analysis of your retirement program would be incomplete by merely focusing on the DC plan in isolation. For many of your team members, the non-qualified and equity compensation programs deliver improved benefits, especially as social security fades in importance for higher-paid individuals. A quick graph of these impacts is below, showing hypothetical team members at various pay levels. Note, we also show the potential impact of changing to the safe-harbor version to the basic match suggested above, to highlight how the current additional savings driven by this design can have a positive impact on all pay level. Overall, the ability to examine your entire retirement package is critical both for you as the plan sponsor as you make plan level decisions, as well as for your team members who have to make decisions for themselves.
Assumes annual ROR of 6%, 3.5% Salary Growth (except for $500k avg person who has salary growth of 4.5%) inflation of 2%, and Equity Compensation is 20%/year or applicable executive while an executive. Assumes all employees begin contributing at age 25 over a 40 year career, contribute enough to get full match in Qualified and NQ plans (if eligible) or up to the auto-escalation cap. Also shows only those employees ineligible for DB plans currently. Current plan features - eligible employee contributes starting at 6% of eligible pay full 4.5% employer match. Alternative plan features - eligible employee contributes starting at 6% escalated to 10% received full 3.5% employer match. For employees eligible for the DC non-qualified plan, contributions would be similar. The assumed rates of return in this chart are hypothetical and do not guarantee any future returns nor represent the returns of any particular investment. Amounts shown do not reflect the impact of taxes on pre-tax distributions. Individual taxpayer circumstances may vary. This is for illustrative purposes only. Social security replacement ratio based on salary assumptions and SSA related distribution payout assumptions. Other replacement ratio based on calculated ending balance after being employed for 40 years and a 4% distribution ratio.

Thank you for your consideration.

Connect with us:    Principal.com

Terms of Use   |   Disclosures   |   Privacy   |   Security   |   Report Fraud


The subject matter in this communication is educational only and provided with the understanding that Principal® is not rendering legal, accounting, investment or tax advice. You should consult with appropriate counsel, financial professionals, and other advisors on all matters pertaining to legal, tax, investment or accounting obligations and requirements. Replacement ratio - 80%, Based on our industry experience and GAO Retirement Security Report to Congressional requestors. The estimated average total spending for post-retirement households was about 77 percent of the spending levels for pre-retirement households. GAO, 2013 CE Data; 16-242, Retirement Replacement Rates.
 
Insurance products and plan administrative services provided through Principal Life Insurance Company®. Securities offered through Principal Securities, Inc., 800-547-7754, member SIPC and/or independent broker-dealers. Principal Life, and Principal Securities® are members of the Principal Financial Group®, Des Moines, Iowa 50392. 
 
Principal®, Principal Financial Group®, and Principal and the logomark design are registered trademarks of Principal Financial Services, Inc., a Principal Financial Group company, in the United States and are trademarks and services marks of Principal Financial Services, Inc., in various countries around the world.

© {{CurrentYear}} Principal Financial Services, Inc.

2200131-052022